Balance Sheet
Balance Sheet – View, Review, Chart, and Export Your Financial Position
The RunPTO Balance Sheet provides an overview of your PTO/PTA organization’s assets, liabilities, and organization equity for a selected fiscal year.
The modern Balance Sheet allows treasurers and administrators to review financial balances, select an As-of Date, examine individual account transactions, create financial charts, download reports, and prepare financial information for board meetings.
1. Opening the Balance Sheet
From the RunPTO menu, navigate to:
Financials → Balance Sheet
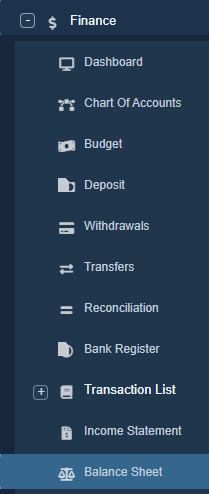
The report opens for your currently selected fiscal year and displays account balances through the fiscal year’s ending date by default.
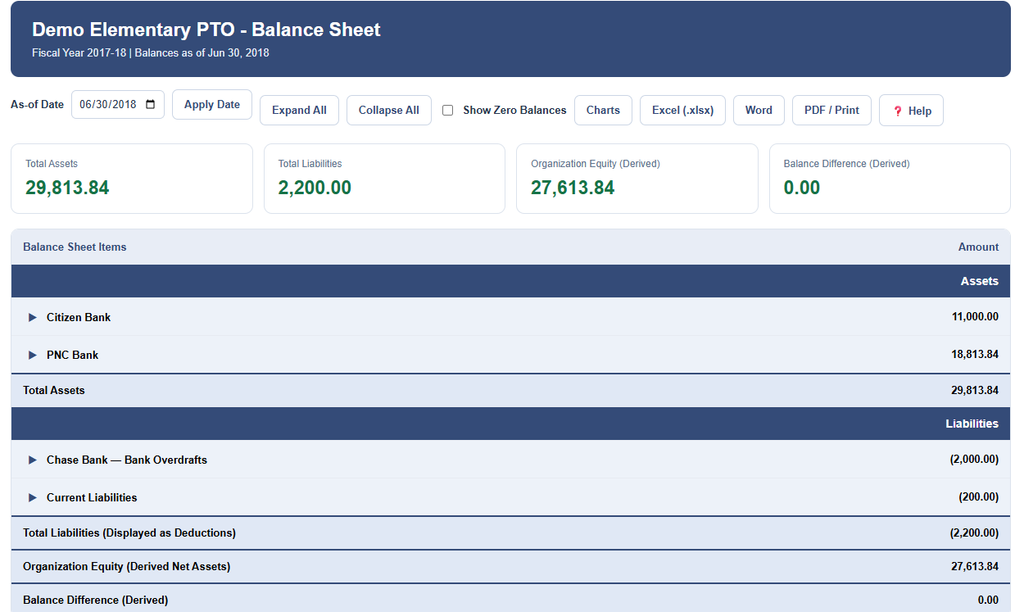
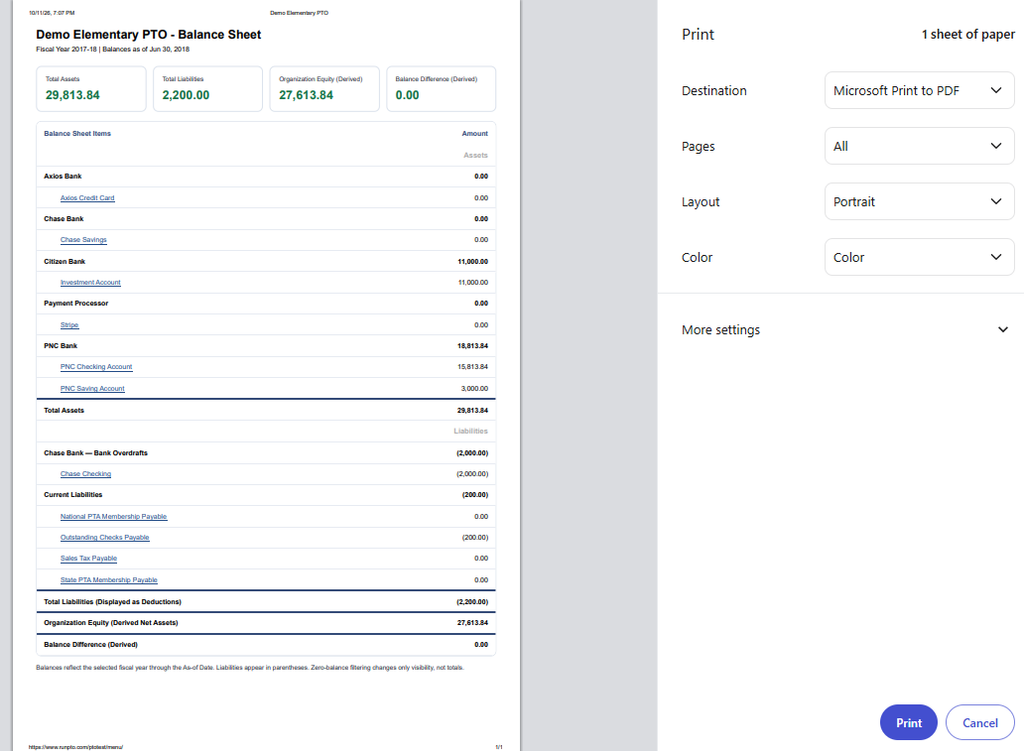
At the top of the report, four summary cards provide an immediate overview:
- Total Assets: Positive bank balances and other recorded assets.
- Total Liabilities: Recorded liabilities, including bank accounts with negative balances.
- Organization Equity (Derived): Assets remaining after liabilities are deducted.
- Balance Difference (Derived): An arithmetic comparison of assets, liabilities, and derived equity.
These summary cards help you quickly understand the organization’s financial position.
2. Understanding Assets, Liabilities, and Organization Equity
The Balance Sheet organizes financial accounts under Assets and Liabilities.
Assets
Assets represent financial resources held by your organization.
Examples include checking accounts, savings accounts, investment accounts, and other asset accounts.
Accounts are organized into groups, making it easy to review balances at both the account and group levels.
Liabilities
Liabilities represent financial obligations and applicable negative bank balances.
For example, a checking account with a negative balance may appear under Liabilities rather than Assets.
Amounts shown in parentheses represent negative financial amounts or deductions.
Organization Equity
Organization Equity (Derived) represents the organization’s net assets.
Organization Equity = Total Assets − Total Liabilities
The Balance Difference (Derived) is calculated using these figures. Because equity is derived from assets less liabilities, a zero balance difference is an arithmetic check, not independent verification of the organization’s accounting records.
3. Select an As-of Date
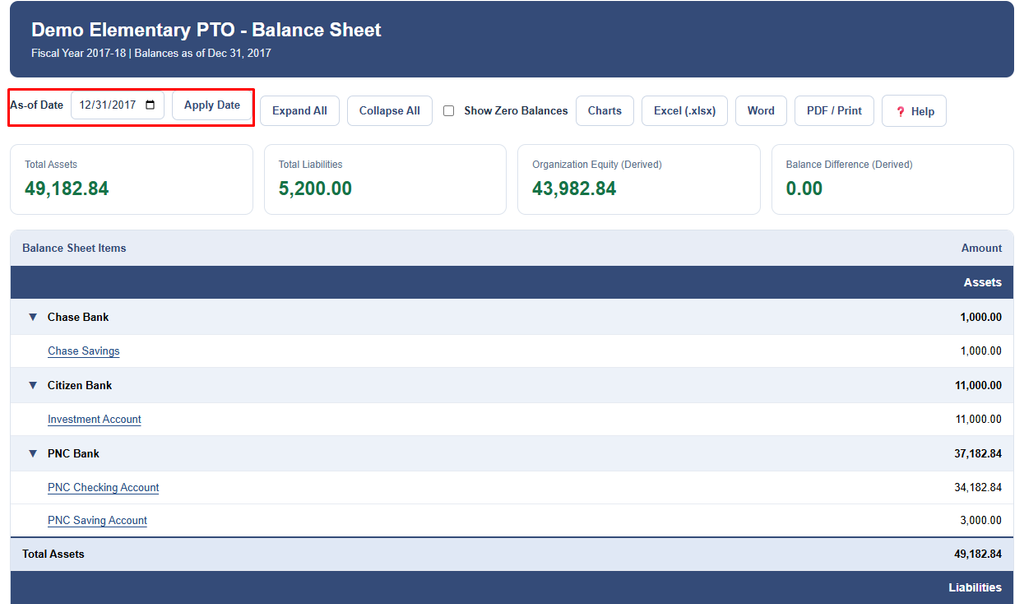
The Balance Sheet allows you to view financial balances through a specific date within the selected fiscal year.
This is useful when preparing financial reports for monthly meetings, quarterly reviews, or year-end reporting.
To select a date:
- Click the As-of Date field.
- Choose a date within the current fiscal year.
- Click Apply Date.
RunPTO recalculates the Balance Sheet using applicable transactions recorded within the selected fiscal year through that date.
For example, selecting December 31 excludes transactions dated after December 31 from that fiscal year’s Balance Sheet.
Important: The calculation uses transactions and opening-balance entries recorded within the selected fiscal year. It does not independently reconstruct balances across all previous fiscal years.
4. Expand or Collapse Account Groups
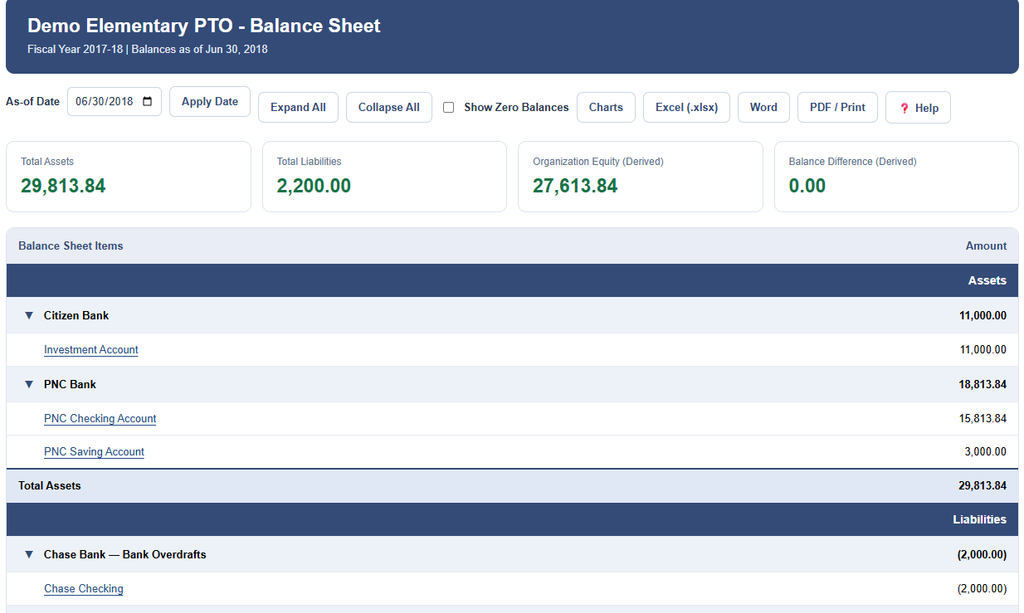
Account groups can be expanded to show individual accounts or collapsed to display summarized totals.
Use the arrow beside an account group to expand or collapse that particular group.
You can also use:
- Expand All: Display all individual accounts.
- Collapse All: Display account-group summaries.
Collapsing account groups is especially useful when preparing a shorter Balance Sheet for a PTO/PTA board meeting.
5. View Individual Account Transactions
The Balance Sheet provides transaction details for individual financial accounts.
To view transactions:
- Find the account you want to examine.
- Click the blue, underlined account name.
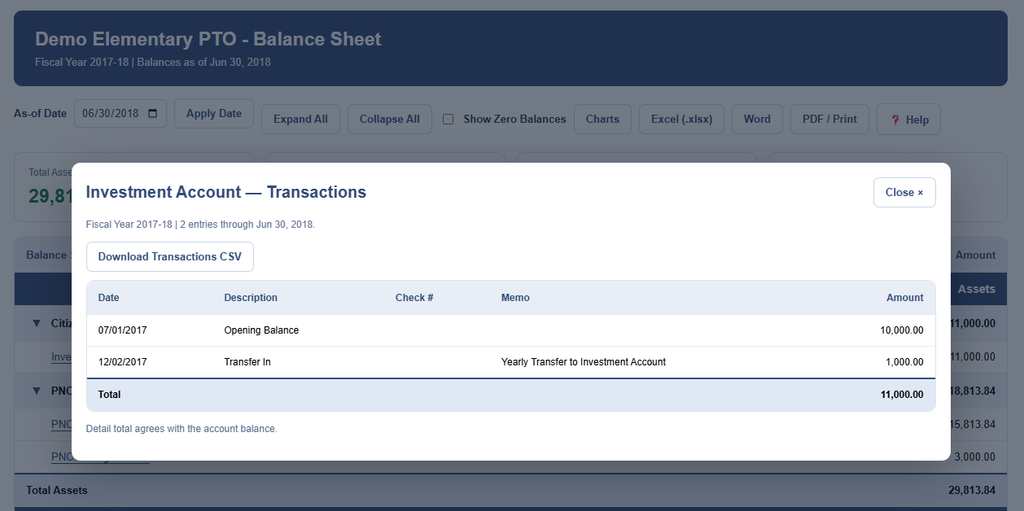
- A transaction window opens showing the entries contributing to that account’s balance.
The transaction window displays:
| Column | Description |
|---|---|
| Date | Transaction date |
| Description | Payee, transaction name, or description |
| Check # | Check number, when applicable |
| Memo | Additional transaction information |
| Amount | Amount added to or deducted from the account |
The bottom of the transaction window displays the total of the listed transactions.
You can download the transaction details using Download Transactions CSV.
Click Close to return to the Balance Sheet.
6. Review Liabilities and Negative Bank Balances
The Balance Sheet identifies liabilities separately from positive financial assets.
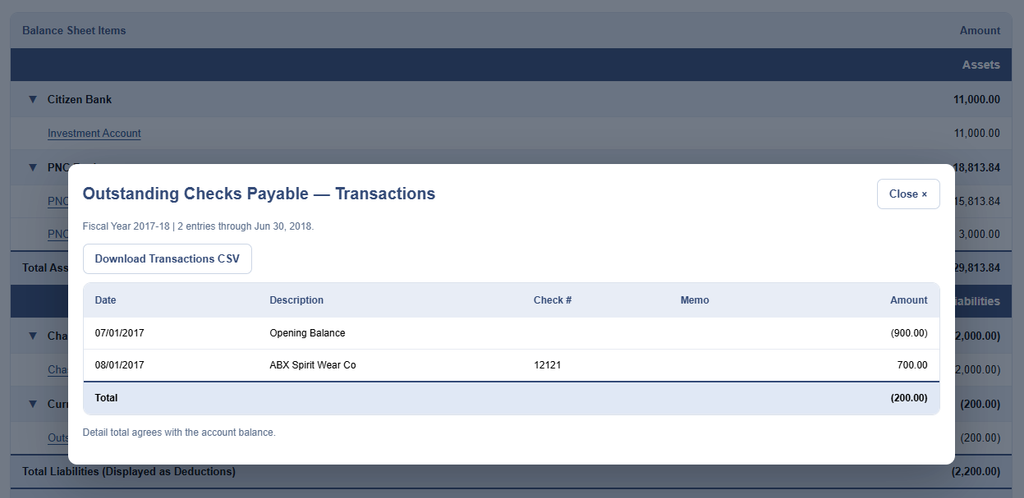
Examples include outstanding checks payable and overdrawn bank accounts.
To investigate a liability, click its account name and review the associated transactions.
For example, you can examine an outstanding checks account to identify transactions that contribute to its balance.
7. Show or Hide Zero-Balance Accounts
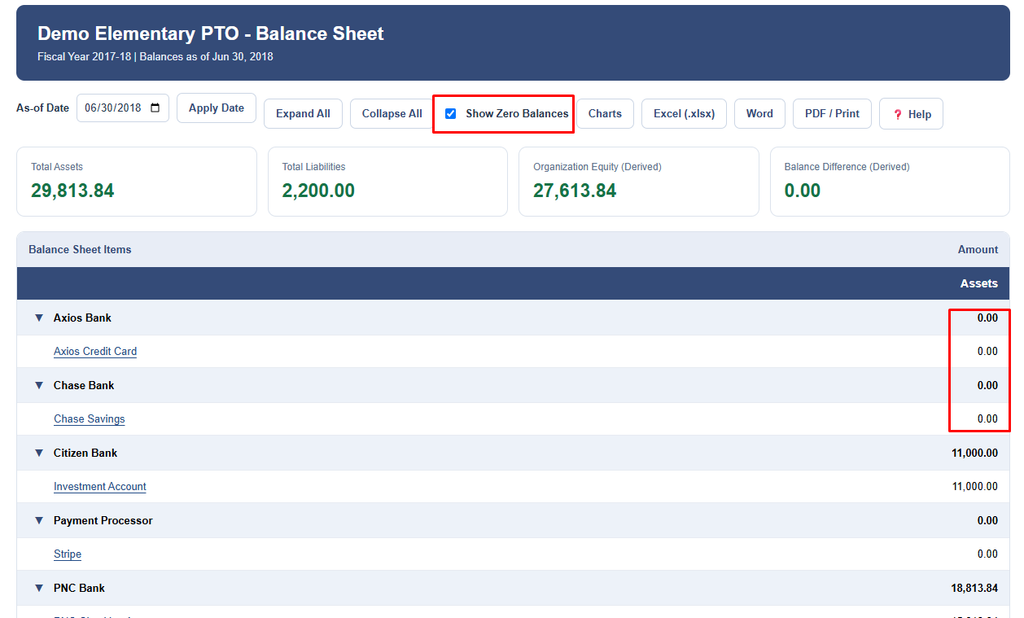
Select Show Zero Balances to display accounts that currently have a balance of zero.
Clear the checkbox to hide individual zero-balance accounts from the report.
This is useful for organizations that have inactive bank accounts or accounts that were previously used but currently have no balance.
An account group with a net balance of zero may still appear if it contains individual accounts with positive and negative balances that offset one another.
For example, one liability account might contain $50 while another contains ($50). Although the group total is zero, both accounts are useful to review.
8. Create Financial Charts
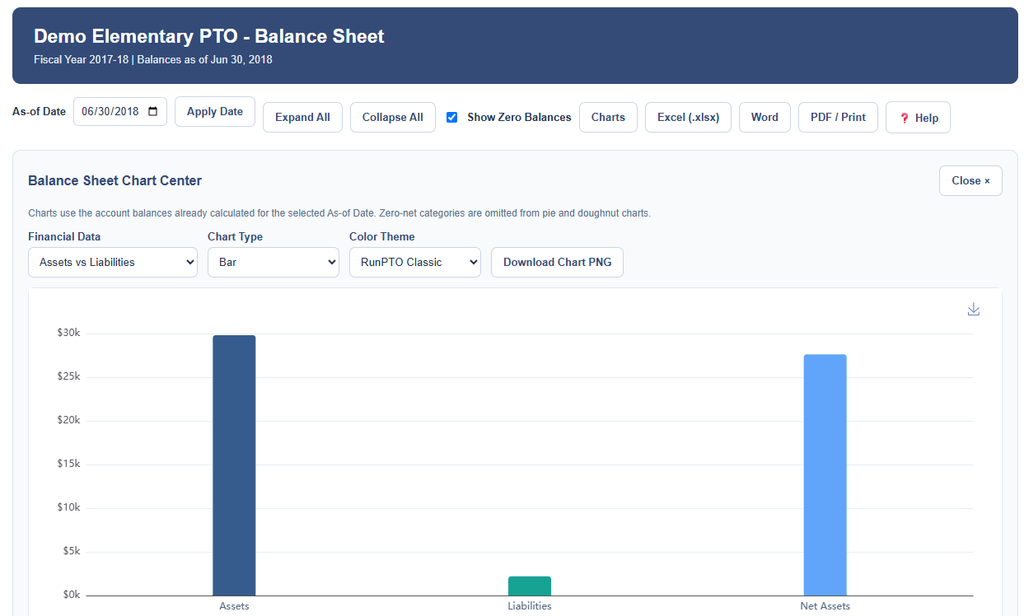
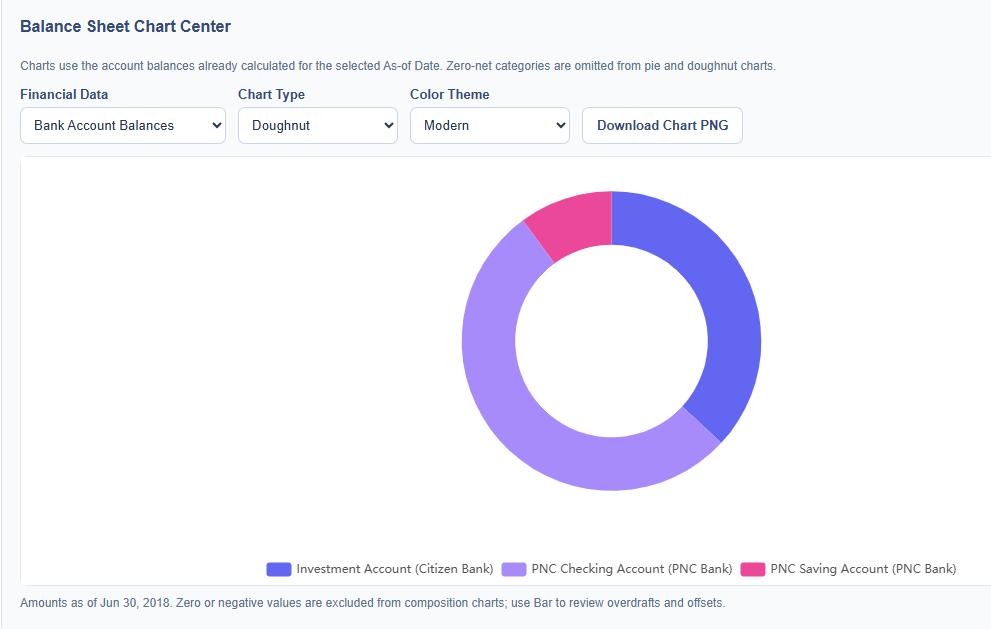
Click Charts at the top of the Balance Sheet to open the Financial Chart Center.
Financial charts make it easier to visualize your organization’s assets, liabilities, and financial position.
Available financial chart data
| Chart | What it displays |
|---|---|
| Assets vs Liabilities | Compares total assets, total liabilities, and derived net assets |
| Bank Account Balances | Shows balances for individual bank accounts |
| Assets by Account Group | Displays the distribution of positive assets across account groups |
| Liabilities by Account Group | Displays liability balances across account groups, including applicable overdrafts |
Choose a chart type
The Financial Chart Center provides four chart types:
- Bar: Compare financial amounts using vertical bars.
- Horizontal Bar: Compare accounts or groups using horizontal bars.
- Pie: Display the relative distribution of positive balances.
- Doughnut: Display positive balance distributions in a circular chart.
Pie and Doughnut charts exclude zero and negative values that cannot meaningfully be represented as positive portions of a total.
For comparing bank accounts that include negative balances, Bar or Horizontal Bar charts are generally more useful.
Choose a color theme
You can customize the chart appearance using four available themes:
- RunPTO Classic
- Ocean
- Modern
- Executive
Download a chart
To save a chart for a board presentation or financial report:
- Open Charts.
- Choose the financial information you want to display.
- Select a chart type.
- Optionally change the color theme.
- Click Download Chart PNG.
The downloaded image can be included in documents, presentations, or meeting materials.
Charts use the balances for the currently selected As-of Date.
9. Export the Balance Sheet
RunPTO provides several ways to download or print your Balance Sheet.
| Option | Description |
|---|---|
| Excel (.xlsx) | Downloads the Balance Sheet as an Excel workbook |
| Word | Downloads a Word-compatible document |
| PDF / Print | Opens the browser’s print interface to print or save as PDF |
The exported report includes the financial information for the selected fiscal year and As-of Date.
Excel export
Click Excel (.xlsx) to download the report. You can open it in Microsoft Excel to review the account balances and totals.
Word export
Click Word to download a document containing the Balance Sheet.
PDF / Print
Click PDF / Print to open your browser’s print interface.
To save a PDF:
- Select PDF / Print.
- Choose Save as PDF as the printer destination.
- Save the document to your computer.
10. Preparing a Balance Sheet for a Board Meeting
The Balance Sheet can be used as part of your PTO/PTA’s monthly or quarterly financial reporting.
A typical process is:
- Open the Balance Sheet for the appropriate fiscal year.
- Select the reporting month’s ending date.
- Review Total Assets, Total Liabilities, and Organization Equity.
- Expand individual account groups when additional detail is needed.
- Review transactions for any account requiring investigation.
- Create a chart to help present the organization’s financial position.
- Export or print the Balance Sheet for the board meeting.
For a more complete financial review, use the Balance Sheet alongside the RunPTO Income Statement.
The Income Statement shows income and expenses over a reporting period, while the Balance Sheet shows recorded financial balances as of a particular date.
11. Getting Help
Click the Help button at the top of the Balance Sheet to open this Knowledge Base article in a separate browser tab.
Your existing Balance Sheet remains open, including its selected reporting date.